SFOE Research · Grant SI/502720-01 · Dec 2023 — Jan 2027

POTEBS.

Investigating the Potential of E-Bike-Sharing Systems for Sustainable Mobility in Different Spatial Types.

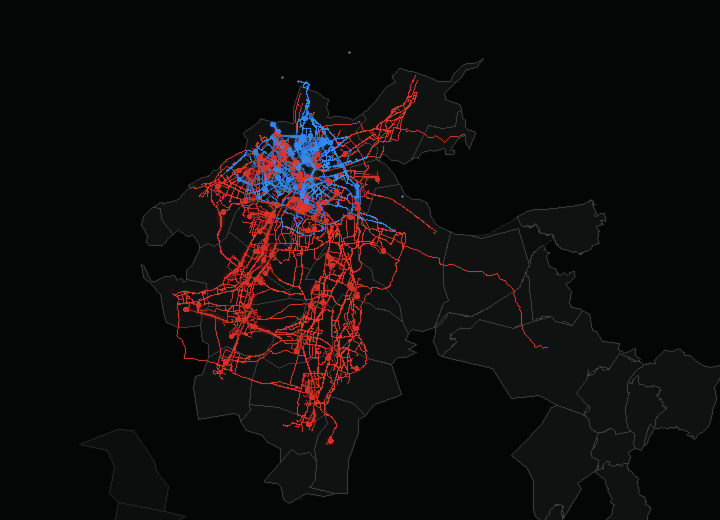
Linking 1,844 survey responses to 1.4 million operational trip records across two concurrently operating systems in Basel, POTEBS identifies what separates power users from dormant registrants — and challenges common assumptions about what drives intensive EBSS use.

Keywords e-bike sharing · usage intensity · multimodal mobility · revealed preference · Gaussian Mixture Model · multinomial logit · Basel

DurationDec 2023 — Jan 2027
LeadHSLU, Luzern
PartnersUniBas · PubliBike · Pick-e-Bike
FundingSFOE · SI/502720-01
Interim Finding / 01

Electric bike sharing appears useful in a real but bounded way.

Rather than being mainly an expression of environmental ideology, intensive EBSS use seems to emerge where shared e-bikes solve concrete mobility problems better than available alternatives.

— POTEBS · HSLU · Basel
Overview

Scale meets depth.

[01] Trips
1.4M
operational trip records
[02] Respondents
1,844
survey respondents retained
[03] Linked
1,743
linked user cases (MNL model N)
[04] Gini
0.77
Gini coefficient of usage concentration
Start Main findings Read the argument in five claims. Evidence What explains intensity Compare behavioral, attitudinal, and demographic predictors. Spatial Maps and route dynamics Explore service areas, trip geography, and routed movement. Reference Methods and survey Open the technical methods page.
Questions

What this project asks.

How can EBSS support the mobility transition as part of a flexible multimodal mobility system?
RQ 01
Which user groups use EBSS and in what multimodal contexts; what hampers use and what benefits do users report?
RQ 02
What business models for EBSS or EBSS–PT combinations could build on user needs?
RQ 03
How can EBSS contribute to sustainable mobility in urban and peri-urban regions, and which measures support this?
Background

What prior research tells us.

EBSS is widely discussed as a lever for sustainable urban mobility — yet a critical question remains open: which users ride intensively, and why?

Adopters & usage patterns

Usage is narrow and unequal.

EBSS users skew young, male, and highly educated. The top 22% of users account for 81% of trips, and roughly half of all registrants never return after sign-up — making system viability dependent on a small core of frequent riders.

Mode characteristics

EBSS is a distinct mobility mode.

Electric assistance lowers effort and extends cycling range. Shared e-bike trips are longer in distance yet shorter in duration than pedal-bike trips, with demand more resilient to adverse weather — positioning EBSS to compete with PT on longer urban trips.

Economics

System viability is fragile.

Vehicle, maintenance, and rebalancing costs frequently exceed revenues, creating subsidy dependence. Users show strong price sensitivity; promotional free-ride periods generate short-lived demand spikes rather than sustained high-frequency use.

System design

Dock-based and free-floating attract different users.

Dock-based systems suit predictable commute corridors; free-floating enables flexible point-to-point travel but introduces availability uncertainty. Evidence from Zurich suggests commuters prefer dock-based EBSS, while free-floating shows more dispersed spatial use — yet whether intensity predictors differ across designs remains unstudied.

Behavioral drivers

Environmental attitudes are an uncertain predictor.

Environmental attitudes are frequently cited as adoption motivators, yet a persistent gap between pro-environmental self-identity and actual travel behavior is well documented. Whether environmental concern or perceived usefulness drives intensive EBSS use is empirically unsettled.

The research gap

No existing study provides clear empirical insight into which personal characteristics make someone more likely to use EBSS frequently — and how this interacts with system type. POTEBS directly addresses this gap by linking ~1.4 million operational trip records to individual survey data across both system types in Basel.

Timeline

Timeline.

2023
Project kick-off
Dec 2023
Project launch
POTEBS funded by the Swiss Federal Office of Energy (SFOE). Operational trip data from Pick-e-Bike and PubliBike Velospot in the Basel metropolitan area forms the empirical backbone.
2024
First conferences · team expansion · public outreach
May 2024
First conference paper — STRC 2024
Stiebe & von Arx. Comparative analysis of user characteristics in free-floating and station-based e-bike sharing. Swiss Transport Research Conference, Ascona.
Sep 2024
European Transport Conference — ETC 2024
Presentation of updated comparative findings at ETC, Antwerp.
Oct 2024
Team expansion
Benjamin Weggelaar (University of Basel) joins the research team.
Nov 2024
Public outreach — HSLU Newsletter
"E-Bike-Sharing boomt in der Schweiz!" published by Lucerne University of Applied Sciences and Arts.
2025
Surveys launched · Singapore conference · economics seminar
Jan 2025
Advisory Board Meeting 1
First meeting of the project advisory board with representatives from transport authorities, operators, and policy institutions.
Apr 2025
User surveys launched — Pick-e-Bike & PubliBike Velospot
Linked online surveys distributed to registered users of both e-bike sharing systems in the Basel area.
May 2025
Survey EBSS Non-Users — TNW Area
Survey of non-users within the TNW (Tarifverbund Nordwestschweiz) area to capture mobility behaviour and barriers to e-bike sharing adoption.
Nov 2025
mobil.TUM 2025 — Singapore
Stiebe & von Arx. Understanding user behavior in dock-based and free-floating e-bike sharing systems. Nanyang Technological University.
Dec 2025
WWZ Economics Lunch Seminar
Stiebe. Pragmatists, Not Idealists: What drives e-bike sharing usage intensity. Faculty of Business and Economics, University of Basel.
2026
Journal submission · ongoing dissemination
Mar 2026
Journal submission — Transportation Research Part D
Stiebe, Krysiak, von Arx & Weggelaar. Pragmatism, Not Ideology: Drivers of E-Bike Sharing Usage Intensity. Submitted to Elsevier TRD, currently under review.
Mar 2026
Sustainable Future Research Lunch — University of Basel
Stiebe & Weggelaar. Drivers of e-bike sharing usage intensity: evidence from free-floating and dock-based systems in Basel.
Q4 2026
Final report — SFOE
Submission of the final scientific report to the Swiss Federal Office of Energy, consolidating findings, methodology, and policy implications across the four-year project period.
2027
Project closure · final dissemination
Jan 2027
Project conclusion
Formal end of the POTEBS research project (SFOE Grant SI/502720-01). Final advisory board meeting, archival of anonymised analytical datasets, and handover of operational learnings to consortium and sister-project partners (incl. U-Two).
Findings

What the results show.

Behavioral and utilitarian factors consistently outperform attitudinal and demographic predictors of usage intensity (combined MNL: pseudo-R²=0.128, N=1,743).

I.
Usage concentration

Extreme concentration and near-50% dormancy.

48% Low
39% Medium
13% Power
≈ 1 rental / 5 months monthly riders every 2–3 days
Gini 0.77 · Top 20% generate 80.3% of trips

The top 20% of users generate 80.3% of all trips. Three segments emerged: low-intensity (48%, ~one rental every five months), medium-intensity (39%), and power users (13%, riding every 2–3 days).

II.
The environmental paradox

Pro-environmental self-identity reduces power-user likelihood.

−32% RRR 0.68 · p<0.001 Environmental self-identity → power-user likelihood

Users with stronger environmental self-identity were 32% less likely to be power users — directly contradicting Theory of Planned Behavior predictions. In Basel's sustainable transport context, green-minded users may already travel by foot, bike, or PT.

III.
What actually drives intensity

Weather resilience and multimodal integration.

+40% RRR 1.40 · p<0.001 Revealed temperature variance
+64% RRR 1.64 · p<0.001 Multimodal complementarity

Revealed temperature variance raised power-user likelihood by 40%. Multimodal complementarity — integrating EBSS with PT as a reliable fallback — was the strongest attitudinal predictor.

IV.
Two archetypes

Routine optimizers and flexibility maximizers.

+178% RRR 2.78 Dock-based · weather resilience (PubliBike)
+114% RRR 2.14 Free-floating · multimodal complementarity (Pick-e-Bike)

Dock-based routine optimizers are urban commuters with exceptional weather resilience and habitual corridor use. Free-floating flexibility maximizers are younger multimodal travelers for whom seamless PT integration dominates. Neither archetype is distinguished by environmental ideology.

V.
Mode substitution

EBSS primarily substitutes public transport, not cars.

Provider → mode substitution. Flow width = users who substitute the mode at least sometimes (Table 3, n=1,743).
Three-quarters of displaced trips come from already-sustainable modes.

76% of users substitute PT at least sometimes and 51% substitute walking — versus only 34% who substitute car trips, and that figure is calculated only on the subsample of users who actually own or can access a car. Car substitution is markedly higher in the free-floating system (36% vs 22% for dock-based; V=0.20, p<0.001), reflecting its extension into more car-dependent suburban catchments. The headline implication: direct decarbonization is bounded — EBSS works as a public-transport overflow valve and last-mile bridge rather than a car replacement.

The incubator effect

Private e-bike ownership significantly reduces shared system use (RRR=0.76, p<0.001). Users who report that EBSS motivated their purchase of a private e-bike suggest these systems function as an incubator — gradually graduating users from shared toward private micromobility. In Basel's transit-rich, low-motorization context, EBSS may partly undermine its own long-term demand by seeding private ownership.

Evidence

Behavior beats ideology, in one chart.

Relative-risk ratios from the combined multinomial logit (high-intensity vs low-intensity, N=1,743). Dots are point estimates, horizontal bars are 95% confidence intervals where standard errors are reported in the manuscript. Behavioral predictors carry; attitudes do not — except in the wrong direction.

Revealed behavior Attitudes & perceptions Mobility tools Demographics
The strongest power-user predictors are revealed — temperature variance across actual rides (RRR 1.40) and multimodal complementarity behavior (RRR 1.64). Pro-environmental self-identity is significant and negative (RRR 0.68): more green-minded users are 32% less likely to be among the most frequent riders.
RRR = exp(β). Values > 1 raise power-user likelihood; values < 1 reduce it. Reference category: low-intensity users. CIs computed as exp(β ± 1.96·SE) for predictors with SE reported in §3.4 of the manuscript; point-estimate-only rows shown without bars.
Recommendations

What this means in practice.

EBSS is a useful but bounded tool. Policy calibrated to this reality — investing in the conditions that sustain power users rather than chasing broad environmental appeal — will extract considerably more value.

System design

Portfolio over exclusivity.

Dock-based and free-floating systems serve complementary functions: dock-based anchors commuter demand; free-floating extends suburban coverage. The free-floating system achieved 2.5× more rentals per bike per day — different efficiency profiles that justify co-existence rather than competition.

Messaging

Utility, not sustainability.

Sustainability-focused marketing may actively misfire among the power-user segment. Communications should lead with concrete functional benefits — door-to-door speed, weather-independent commuting — rather than environmental framing.

Infrastructure

Reduce weather barriers.

Weather resilience is the strongest behavioral predictor of intensive use. Winter maintenance of cycling paths, covered parking at transit hubs, and real-time path condition information could meaningfully expand the power-user base.

Service quality

Reliability protects the power-user pipeline.

Reliability concerns disproportionately suppressed potential power users. Fleet sizing, demand-responsive rebalancing, real-time availability, and short-term advance booking (e.g., 15-minute windows) could convert occasional riders into regulars.

Integration

Connect EBSS into the multimodal ecosystem.

Three integration priorities: fare integration (combined EBSS + PT subscriptions), information integration (EBSS availability in journey planners), and physical integration (stations at key transit hubs).

Evaluation

Rethink what counts as success.

Direct decarbonization is limited — most substituted trips come from sustainable modes. Evaluation frameworks should reflect EBSS's broader role: multimodal glue, a PT overflow valve, and a confidence-builder for car-free lifestyles.

From research to practice · U-Two field test

Several of these recommendations — particularly fare integration with public-transport subscriptions — are now being tested under real-world conditions in the Basel region. The U-Two field test, led by FHNW with HSLU, BVB, BLT and TNW, evaluates how shared bicycles and e-bikes can be integrated into the U-Abo and GA tariffs. POTEBS's evidence on multimodal complementarity as the strongest power-user predictor (RRR 1.64) provides direct empirical motivation for that experiment. Field test runs through 2026.

Maps

Basel as a testbed — and a demanding one.

Basel is an ideal but demanding testbed: Switzerland's highest PT modal share, a strong cycling culture, and the lowest motorization rate among major Swiss cities mean sustainable travel is already the norm — making EBSS adoption harder to explain by necessity alone.

[01] PT share
32.5%
PT modal share — highest in Switzerland
[02] Cycling
11.7%
Cycling modal share
[03] Motorization
319
Cars per 1,000 inhabitants — lowest among major Swiss cities
[04] Operators
2
EBSS operating simultaneously since Sep 2021

The map shows a commune-based representation of the active EBSS service areas. Municipalities can be displayed separately for Pick-e-Bike only, PubliBike Velospot only, and the overlap of both systems. PubliBike Velospot stations can be toggled on as an additional layer. Communes outlined in dashed gold are part of the Pick-e-Bike pilot expansion launching 01.06.2026 for six months (Lausen, Itingen, Sissach, Gelterkinden — one station each).

Routes

A week of e-bike movement.

OSRM-routed Pick-e-Bike and PubliBike Velospot trips reveal the temporal rhythm behind the aggregate patterns: short inner-city hops, commuter pulses, and longer cross-suburban movements passing through the same street network.

Mode
Operator
33 min/s
Tap once to load and play · 1,800 OSRM-routed trips
Mo 00:00
Pick-e-Bike sample: 900 trips PubliBike Velospot sample: 900 trips Path geometry: local OSRM bicycle routing Period: ISO week 35/2024
Trip Geography

Where trips begin and end.

Each point represents a 200 m grid cell. Colour intensity reflects trip count on a log scale, clamped at the 99th percentile to reveal spatial differentiation across the full distribution. Filter by time of day or provider to compare patterns between systems.

Show
Provider
Time of day
Loading trip data…
lower density
higher density
Usage Concentration

Lorenz curves.

Interpretation

A Gini coefficient of 0.77 describes extreme inequality — comparable in magnitude to national income distributions in some of the world's most unequal economies, here applied to trip generation. The typical registered user contributes almost nothing to system activity; a tiny minority drives almost everything.

Each panel shows the cumulative share of trips (or cycling minutes) as a function of the cumulative share of users, for Pick-e-Bike, PubliBike Velospot, and the combined sample. The diagonal represents perfect equality. Hover over the curves for exact values.

Trip count — All users

Cumulative share of trips by user percentile

Duration (min) — All users

Cumulative share of minutes ridden by user percentile

Trip count — Survey respondents

Linked subset (N=1,743)

Duration (min) — Survey respondents

Linked subset (N=1,743)
Partners

Partners.

[01] Funding
Swiss Federal Office of Energy (SFOE)
Grant SI/502720-01
Dec 2023 — Jan 2027
Energy Research & Cleantech programme
[02] Academic Partners
HSLU — Lucerne University of Applied Sciences and Arts
Lead institution
University of Basel
Research partner
HSLU ITM · Mobility CC
Uni Basel WWZ · Env. Economics
[03] Implementation
Pick-e-Bike
Pick-e-Bike · free-floating
PubliBike Velospot
PubliBike Velospot · station-based
Operational trip data
Survey distribution
[04] Sister project
U-Two — FHNW field test
FHNW field test · 2026
Tariff integration of shared two-wheelers
FHNW · HSLU · BVB · BLT · TNW
Pick-e-Bike · PubliBike Velospot
Real-world test of POTEBS's
multimodal-integration finding
Team

Team.

Portrait of Michael Stiebe
[01] Project Manager
Michael Stiebe
HSLU — ITM
Institute of Tourism and Mobility (ITM)
CC Mobility (ITM Mob)
Lucerne School of Business
Zentralstrasse 9, 2. Stock
6003 Luzern
michael.stiebe@hslu.ch
HSLU Profile ↗
Portrait of Prof. Dr. Widar von Arx
[02] Co-Project Manager
Prof. Dr. Widar von Arx
HSLU — ITM
Head, Competence Center for Mobility
Professor
Institute of Tourism and Mobility (ITM)
CC Mobility (ITM Mob)
Lucerne School of Business
Zentralstrasse 9, 2. Stock
6003 Luzern
HSLU Profile ↗
Portrait of Prof. Dr. Frank Christian Krysiak
[03] Co-Project Manager
Prof. Dr. Frank Christian Krysiak
Uni Basel — WWZ
Environmental Economics
Peter Merian-Weg 6
4002 Basel
Switzerland
Tel: +41 61 207 33 60
University profile ↗
Portrait of Benjamin Weggelaar
[04] Research Associate · since 10/2024
Benjamin Weggelaar
Uni Basel — WWZ
Environmental Economics
Assistent / Doktorand
Office 4.47
Peter Merian-Weg 6
4052 Basel
Switzerland
Tel. +41 61 207 24 56
benjamin.weggelaar@unibas.ch
University profile ↗
Governance

Advisory Board.

The project is guided by an advisory board of practitioners and researchers from transport, mobility policy, and public finance.

OrganisationSector
WWZ, University of BaselResearch & Economics
Office of Mobility, Canton of Basel-StadtCantonal Transport Policy
Basler Verkehrs-Betriebe (BVB)Public Transport Operations
TNW Tarifverbund NordwestschweizRegional Fare Integration
SBB Swiss Federal RailwaysNational Rail
Federal Roads Office (ASTRA)Federal Infrastructure
Pro Velo beider BaselActive Mobility Advocacy
Outputs

Publications & Presentations.

Related resources